Delineation of VMS deposits in Bathurst Mining Camp,
NB, based on lineament analysis and joint interpretation of 3D FTG and magnetic data inversion
Authors : Pei Yang1, Alexander Peace1, Colm Murphy2, Alan Morgan2, Liam Clark2 (1. McMaster University, St. John's; 2. Bell Geospace)
Tuesday August 29 - GM 2: Applications - Room 372B
Session begins 10.20AM, this talk, 10:45AM
Objectives
The Bathurst Mining Camp (BMC) in New Brunswick is one of Canada's oldest mining areas for volcanogenic massive sulfide (VMS) deposits and underwent extensive geophysical surveying in the early 2000's that included airborne full tensor gradiometry (FTG) and magnetics. Although numerous previous works on VMS within the BMC have been performed, there are still many uncertainties. This study improves the understanding of the structural characteristics of the BMC region and delineates
the distribution, geometries, and dimensions of the VMS deposits in the BMC.
Methods and Procedure
The 3D FTG data was revisited using the source body migration methodology, and the tensor component information, Txz and Tyz, are used to calculate lineaments for a
regional-scale lineament analysis in the study area. According to the calculated lineaments and relatively recent drilling sites, the Stratmat and Heath Steele
areas located in the southwestern region of the BMC are chosen as the area of interest for geophysical inversion. The subsequent inversion of the FTG gravity
and available magnetic datasets identifies the subsurface density and susceptibility distribution. Slices at depths and sections extracted from inverted 3D cubes are compared with both potential mineralized zones from existing geologic models and drilling sites in the Stratmat and Heath Steele areas in order to demonstrate the advantages of FTG data and the reliability of inversion of FTG and magnetic datasets.
Observations
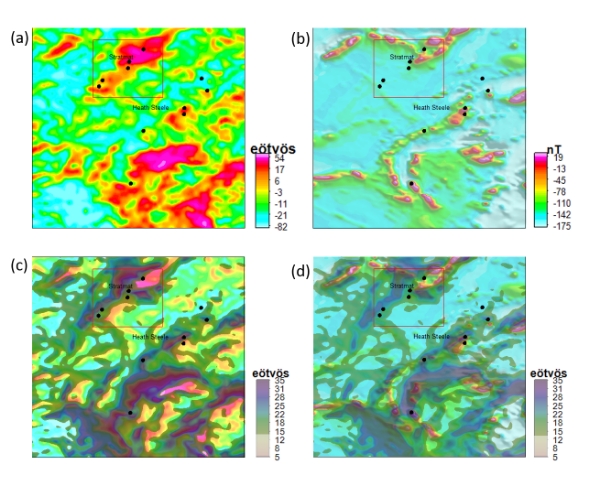
The lineaments identified from the Txz and Tyz tensor components considerably enhance linear features of the BMC, displaying a good match with regional-scale faults. In the Heath Steele area, the lineament patterns calculated from Txz and Tyz components is in a good agreement with positive magnetic anomaly (Fig. 1 ).
In the Stratmat area, the lineament pattern has a good match with the interpreted Stratmat fault (Fig. 1 ).

Figure 1: (a) and (b) are FTG data (Tzz) and residual magnetic intensity (RMI} data in the Stratmat and Heath Steele areas within Bathurst Mining Camp, NB, respectively. (c) Tzz with lineament overlay from the TxzTyz. (d) RMI with lineament overlay from the TxzTyz.
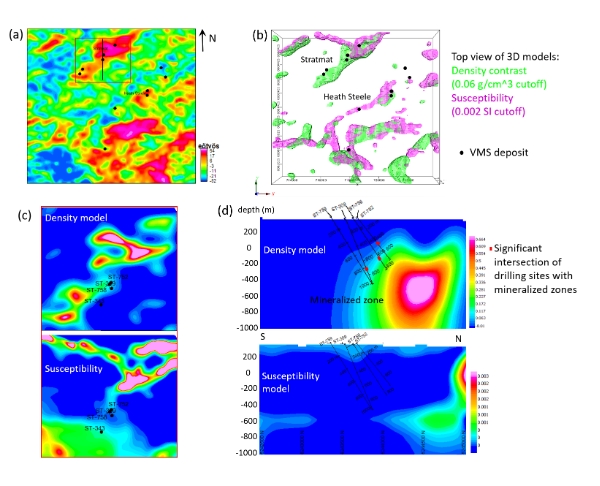
Inversion results from FTG data appear to be geologically reasonable and largely consistent with existing geologic understanding and drilling sites (Fig. 2). The major mineralized zones appear to distribute within or around the edge of high density zones in the Stratmat area. In comparison, only one proven mineralized zone falls into the high-susceptibility zone in this area. The high susceptibility zone in the Heath Steele area follows a linear pattern that coincides with the edges of the positive FTG anomalies (Figs. 1 d and 2b ). Interval of semi-massive and massive sulfides interbedded with volcanics are drilled along borehole ST-309, ST-758, and ST-752, which well agrees with FTG inversion result (Fig. 2d). The susceptibility signatures along these boreholes are not evident, likely due to mafic dykes. Overall, this study reveals more detailed lineament patterns of the study area and identifies advantages of FTG data in locating VMS deposits. Geometry and distribution of potential mineralized zones are delineated from FTG gravity and magnetic inversion.

Figure 2: (a) FTG data (Tzz) in the Stratmat and Heath Steele areas. (b) Results from FTG data and magnetic inversion; (c) Slice of inversion result at 400 m depth below surface in the Stratmat area, indicated by the red rectangle in Figure 2a. The upper and lower panel respectively indicates density contrast model and susceptibility model. (d) Section from inversion result, corresponding to the black line indicated in Figures 2a and 2c.
High-resolution 3D FTG datasets have a striking advantage of delineating exploration targets in the region within complicated structure and less drilling sites. Joint interpretation based on FTG and magnetic datasets is well suited to instigate more targeted mineral exploration success.


